5 Study Hacks to Improve Your Statistics Learning Results

- The explain-back method forces you to identify gaps before they become test-day problems.
- Concept maps reveal how statistical topics connect, improving problem-solving transfer.
- Varying parameters in solved problems builds intuition beyond single-answer memorization.
- Deliberately planting and hunting errors develops metacognitive awareness for exams.
- Teaching concepts to others is the ultimate proof of genuine statistical understanding.
When you’re struggling with statistics homework, seeking professional help can feel like a lifeline. But what if you could transform that temporary support into lasting understanding and academic confidence?
The smartest students don’t just use statistics tutoring to complete assignments; they use it as part of a strategic learning system that builds genuine proficiency.
The challenge with statistics is that concepts build upon each other in a cumulative knowledge structure. Each topic from probability and hypothesis testing to regression analysis and Bayesian inference connects to what comes next.
Active, spaced practice beats cramming. In recent 2025–2026 studies, retrieval practice (quizzing yourself from memory) and spaced learning (short, repeated sessions) consistently improve exam performance across college courses and professional programs. You’ll use both plus two simple tracking systems to squeeze the most out of any statistics help you tap.
To give you a clear path forward, here is a visual roadmap of the five active learning strategies we will cover.
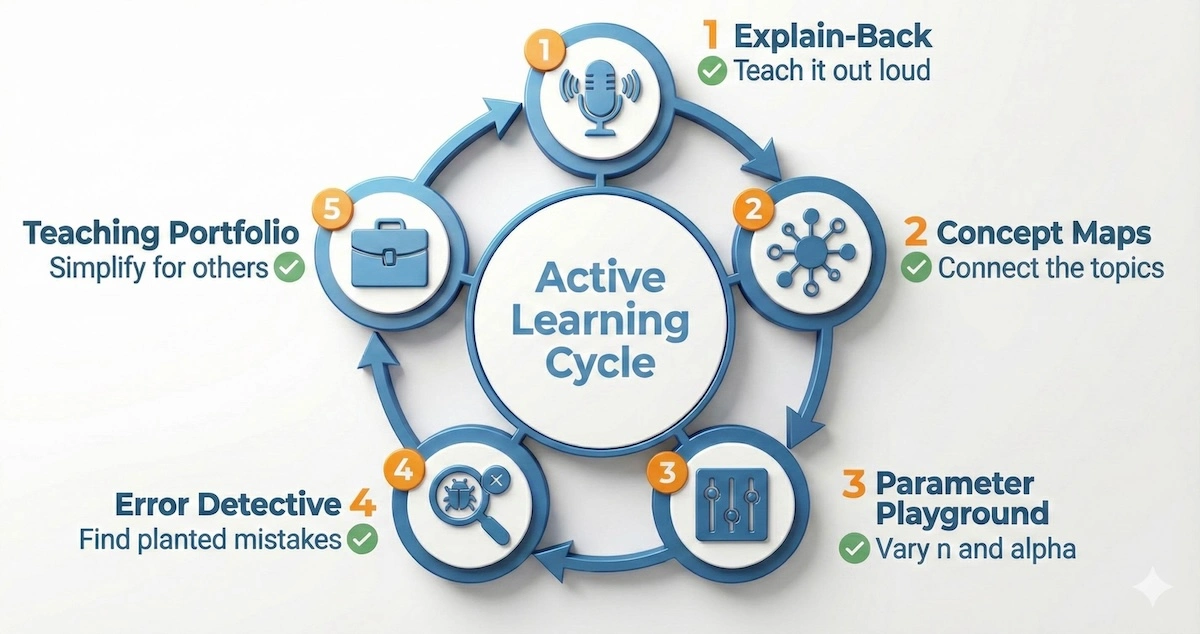
By cycling through these five steps, you move beyond simple homework completion to actual mastery. If you’re also preparing for a standardised exam, working with an AP Statistics tutor can help you apply these same strategies to exam-style questions.
Study Hack #1: Use the Explain-Back Method After Statistics Help
Here’s something I learned the hard way during my own statistics journey: receiving a perfectly solved assignment doesn’t automatically mean you understand the process. The “explain-back” method bridges this crucial gap.
How it works: After receiving your completed statistics homework from a help service, don’t just submit it and move on. Instead, take 15-20 minutes to walk through each solution step-by-step, explaining the process out loud as if you’re teaching it to a friend who’s never seen statistics before.
Why This Works So Well
When you receive help with complex problems like regression analysis or probability distributions, your brain often thinks “I get it” without actually processing the underlying logic. The explain-back method forces you to identify gaps in your understanding before they become test-day disasters.
It can be hard to know exactly when to stop studying. This flowchart guides you through the ‘Explain-Back’ decision process.
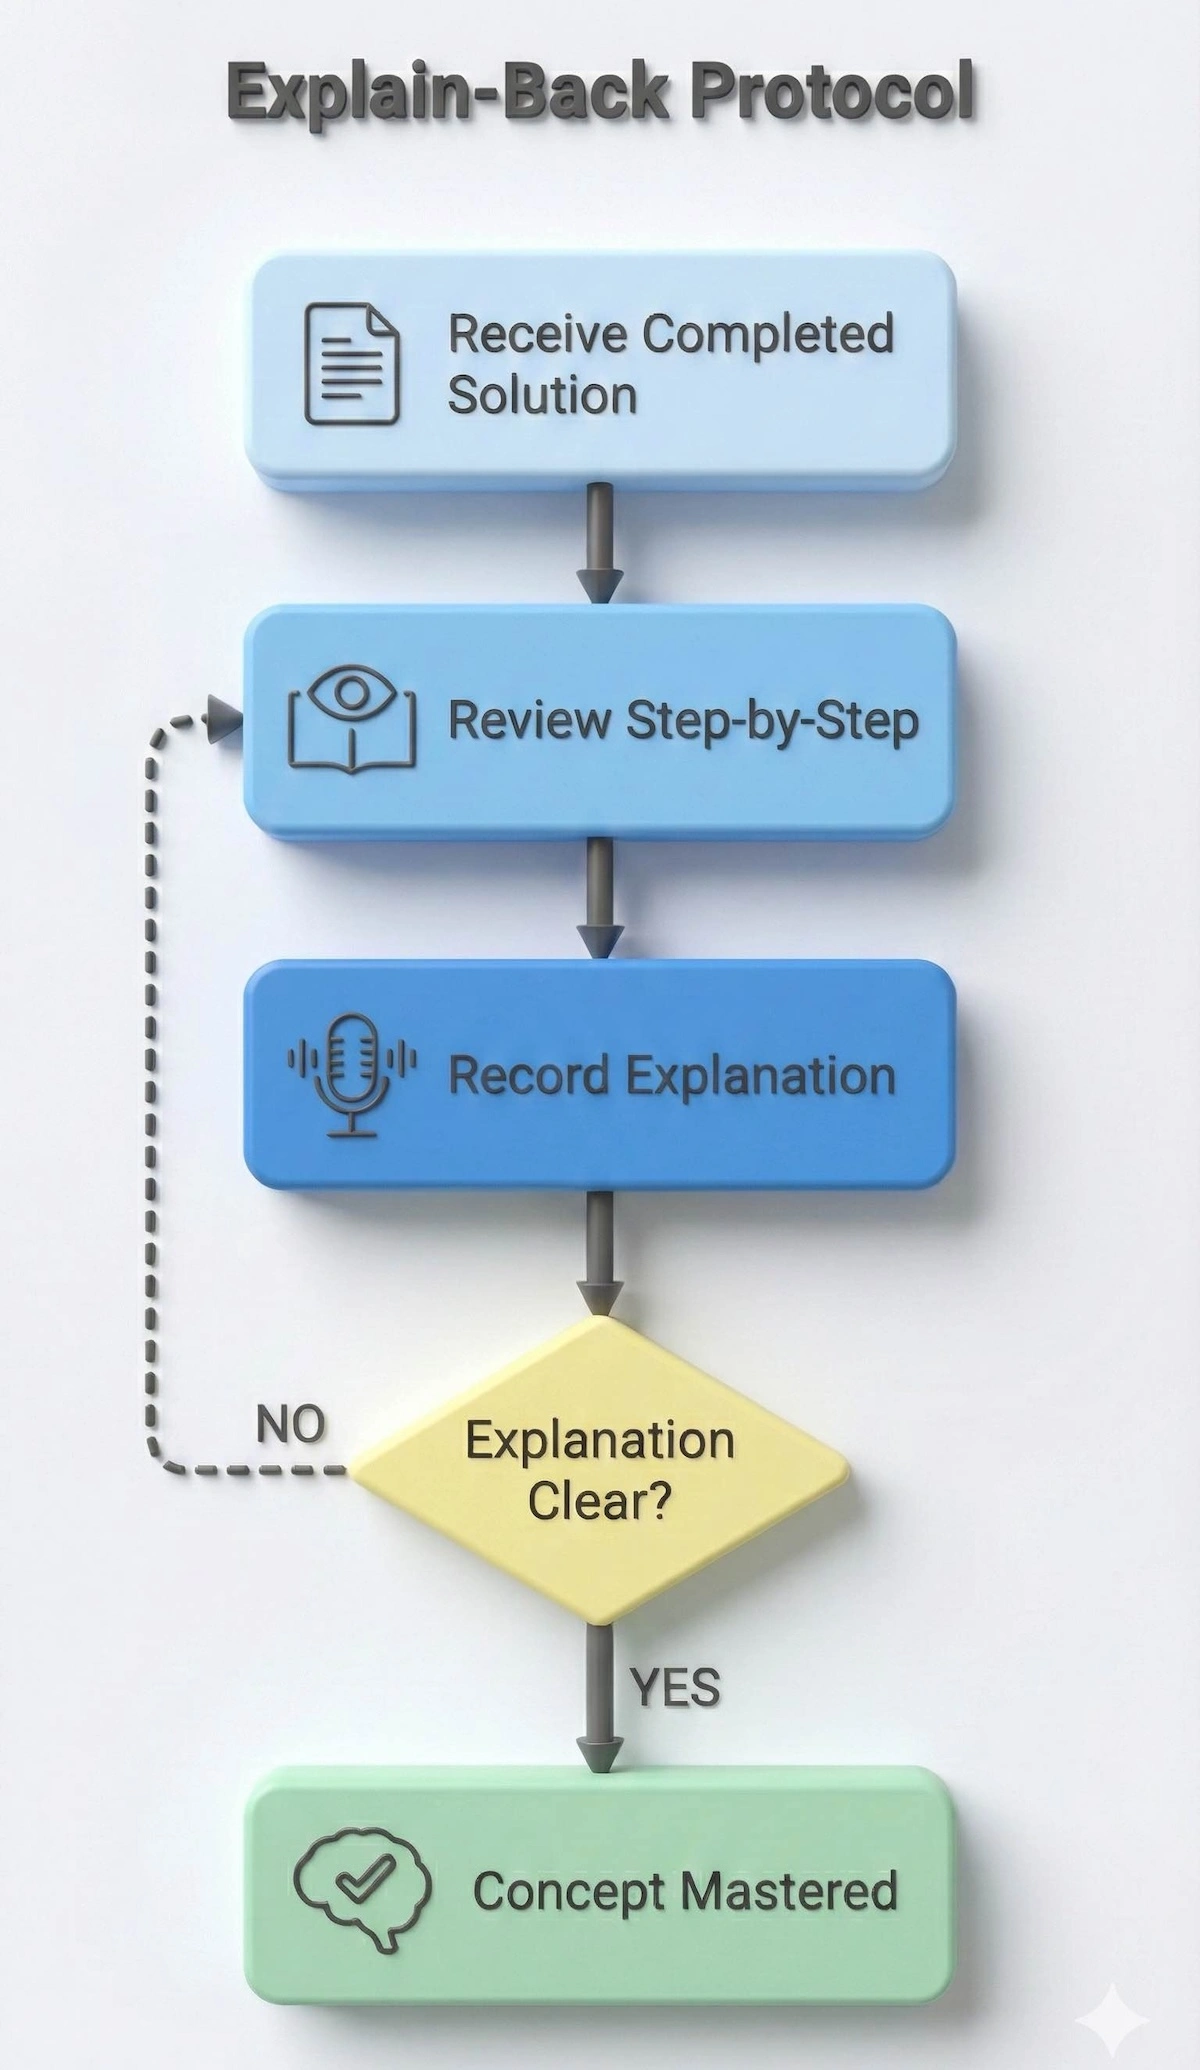
Notice how the cycle doesn’t end until your explanation is clear—that is the definition of true comprehension.
Implementation Strategy
- Record yourself explaining the solution process on your phone
- Focus on the “why” behind each step, not just the “what”
- Identify decision points where different approaches were possible
- Note any steps that feel unclear and research those specific concepts
This technique transforms passive homework completion into active learning, ensuring that professional help actually builds your statistical intuition rather than just padding your assignment grades.
Study Hack #2: Create Concept Maps From Solved Statistics Problems
Statistics isn’t a collection of isolated formulas—it’s an interconnected web of concepts that build upon each other. Most students miss these connections entirely, which is why they struggle to apply knowledge from one context to another.
The strategy: After receiving help on your statistics homework, extract the key concepts and create visual maps showing how they relate to each other and to broader statistical principles.
Building Effective Concept Maps
Start with the main statistical concept from your assignment (let’s say “confidence intervals”) in the center of a page. Then branch out to show:
- Prerequisites: What concepts need to be understood first (sampling distributions, standard error)
- Applications: Where this concept appears in different contexts (A/B testing, quality control, survey analysis)
- Related formulas: How the mathematical expressions connect to conceptual understanding
- Common mistakes: What students typically get wrong and why
The Power of Visual Learning in Statistics
Here’s what’s fascinating about concept mapping: it activates different parts of your brain than traditional studying. While reading through solutions engages your language processing areas, creating visual connections activates spatial reasoning exactly the kind of thinking needed for statistical problem-solving.
Pro tip: Use different colors for different types of concepts (blue for distributions, red for hypothesis tests, green for descriptive statistics). This color-coding helps your brain create stronger memory associations.
Abstract descriptions can be confusing, so let’s look at a concrete example. Here is how a concept map for ‘Confidence Intervals’ connects formulas to real-world applications.
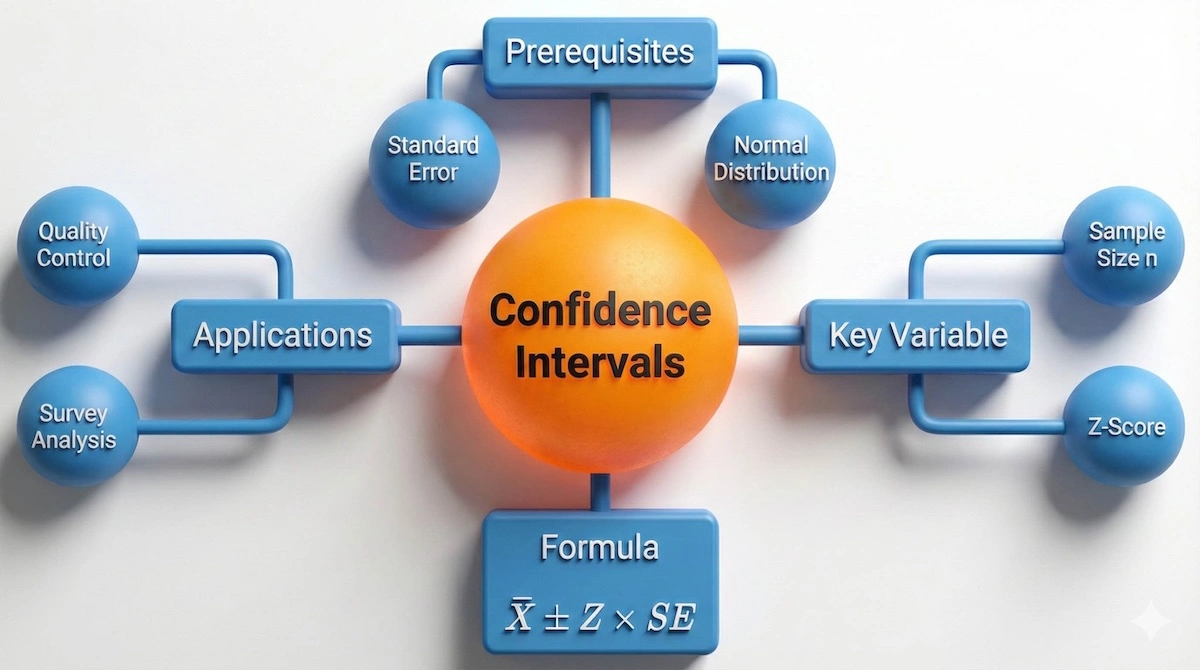
You can build similar maps for Hypothesis Testing, Regression, or Probability Distributions to visualize the bigger picture.
Students who regularly create concept maps from their homework solutions report feeling more confident tackling new problems because they can quickly identify which statistical “toolkit” to use. Instead of memorizing isolated procedures, they develop a mental framework for statistical reasoning.
The same visual-connection approach works well in related quantitative fields — students working on operations research tutoring often find that concept mapping helps them link statistical models to optimisation problems.
Study Hack #3: Practice With the Parameter Playground Technique
One of the biggest advantages of using statistics homework help websites is accessing expertly solved problems with clean, correct calculations. But here’s how to multiply that value: use those solutions as springboards for exploration rather than final destinations.
The core idea: Take the parameters from your completed homework (sample sizes, confidence levels, significance levels) and systematically vary them to see how results change. This transforms static solutions into dynamic learning laboratories.
Setting Up Your Parameter Playground
Let’s say you received help on a problem about testing whether a new medication is effective, with a sample size of 100 and α = 0.05. Here’s how to turn that single solution into a comprehensive learning experience:
Sample Size Exploration:
- Recalculate with n = 25, 50, 200, 500
- Notice how statistical power changes
- Observe the relationship between sample size and margin of error
When you play with the parameters, the results shift in predictable ways. This chart visualizes exactly why increasing your sample size is so critical for precision.
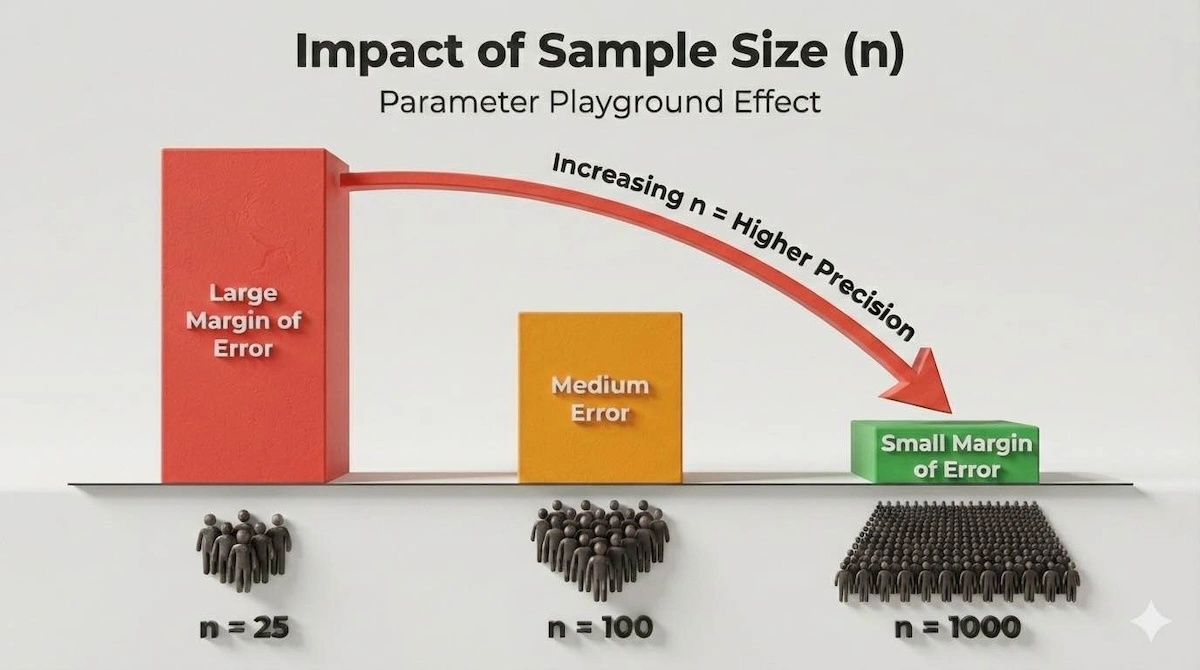
Seeing this relationship visually helps you intuitively understand the formula, rather than just memorizing it.
Significance Level Variations:
- Try α = 0.01, 0.05, 0.10
- See how p-value interpretation changes
- Understand the trade-off between Type I and Type II errors
Effect Size Modifications:
- Adjust the hypothesized difference between groups
- Watch how this impacts statistical significance
- Develop intuition for practical vs. statistical significance
Why This Accelerates Learning
Traditional homework completion gives you one data point. The parameter playground gives you dozens, helping your brain recognize patterns and develop statistical intuition that goes far beyond memorizing formulas.
Students who struggle with visualising data distributions sometimes find that geometry tutoring sharpens the spatial reasoning that makes parameter exploration click.
For a broader look at how AI tools compare with human-led study sessions, see our guide on whether Photomath is a shortcut or a learning tool.
Read More: Top 10 Benefits of Getting Online Statistics Homework Help
Study Hack #4: Find and Fix Mistakes Using the Error Detective Method
Here’s something counterintuitive: looking for mistakes in your perfectly solved homework can be one of the most powerful learning techniques available. The error detective method involves intentionally introducing errors into correct solutions and then hunting them down.
Why this works: Statistics homework help services provide you with error-free solutions, but real statistical reasoning involves recognizing and avoiding common pitfalls. By practicing error detection in a low-stakes environment, you develop the critical thinking skills essential for exam success.
Types of Errors to Practice Detecting
Computational Errors:
- Wrong formula selection
- Arithmetic mistakes
- Unit conversion problems
- Decimal point errors
Conceptual Errors:
- Misinterpreting p-values
- Confusing correlation with causation
- Using inappropriate statistical tests
- Drawing conclusions beyond what data supports
Procedural Errors:
- Skipping assumption checks
- Wrong-sided hypothesis tests
- Incorrect confidence interval interpretation
- Missing data considerations
Implementation Strategy
After receiving your completed statistics homework, introduce 2-3 deliberate errors of different types. Wait 24-48 hours, then review the assignment fresh and try to spot your planted mistakes. This delay prevents you from simply remembering where you made changes.
Advanced technique: Create error-detection worksheets for different statistical topics. For example, make a “hypothesis testing error sheet” with 10 common mistakes students make, then practice identifying these patterns in various contexts.
The Metacognitive Advantage
This technique does something remarkable—it develops your metacognitive awareness of statistical reasoning. Instead of just following procedures, you start thinking about the thinking process itself. You become conscious of decision points where errors commonly occur.
Students who regularly practice error detection report feeling much more confident during exams because they’ve developed an internal “quality control system” that catches mistakes before they compound.
If you’re finding that error patterns in statistics overlap with struggles in calculus, this post on how to find an AP Calculus tutor and score a 5 covers similar diagnostic strategies.
Study Hack #5: Build a Teaching Portfolio to Master Statistics
The ultimate test of understanding isn’t solving problems, it’s being able to teach concepts to others. The teaching portfolio strategy transforms your statistics homework help into a comprehensive teaching resource that benefits both you and your peers.
Core concept: After receiving help on statistics assignments, create brief teaching materials (examples, analogies, simplified explanations) that you could use to help a classmate struggling with the same concepts.
Building Your Teaching Portfolio
For each completed assignment, create:
- One-minute explanations of key concepts in your own words
- Real-world analogies that make abstract statistical ideas concrete
- Common student questions and clear answers
- Step-by-step guides for similar problems
- Warning signs for typical mistakes in this topic area
The Power of Simplification
When you can explain complex statistical concepts in simple terms, it proves deep understanding. If you can’t simplify something, you probably don’t fully grasp it yet—and that’s valuable feedback about where to focus additional study efforts.
Example transformation: Instead of just understanding that “we reject the null hypothesis when p < α,” your teaching explanation might be: “Think of it like a jury trial. We start assuming the defendant (null hypothesis) is innocent. If the evidence against them is really strong (small p-value), and our standard for ‘beyond reasonable doubt’ is high enough (α level), then we convict (reject the null). But if the evidence isn’t quite strong enough, we don’t conclude they’re innocent—we just say ‘not guilty’ (fail to reject).”
Maximizing Your Statistics Homework Help Investment
Let’s talk practical implementation. You’re investing in statistics homework help websites—how do you make sure you’re getting maximum value from that investment?
Choosing the Right Help Service
Not all statistics homework help is created equal. Look for services that provide:
- Detailed step-by-step solutions, not just final answers
- Explanatory notes about why specific approaches were chosen
- Alternative solution methods when applicable
- Assumption checks and data interpretation guidance
- Quality guarantees with revision policies.
Students who want 1:1 guidance on these exact points can explore psychological statistics tutoring as one example of how subject-specific support differs from generic homework platforms.
Common Statistics Study Mistakes and How to Avoid Them
Through years of observing students who use statistics homework help, I’ve noticed patterns in what separates success stories from disappointments.
Mistake #1: Passive Consumption
- The problem: Treating completed homework like a finished product rather than a learning tool.
- The solution: Always spend at least as much time studying the solution as it took to complete the original problem.
Mistake #2: Last-Minute Desperation
- The problem: Only seeking help when deadlines are looming, leaving no time for the learning strategies above.
- The solution: Build homework help into your regular study routine, not your panic protocol.
Mistake #3: Isolated Learning
- The problem: Failing to connect homework solutions to broader statistical concepts or exam preparation.
- The solution: Use the concept mapping technique to show how each assignment fits into your overall statistics knowledge.
Mistake #4: Over-Dependence
- The problem: Relying on help for every assignment without building independent problem-solving skills.
- The solution: Alternate between getting help and attempting problems independently, using the teaching portfolio strategy to build confidence.
For a practical checklist on vetting any tutoring service before you commit, see our guide on how to choose an algebra tutor using a verification checklist — the same criteria apply across quantitative subjects.
Check Out: 15 Best Online Statistics Tutoring Services in 2026: Complete Guide
Advanced Statistics Study Strategies for Different Learning Styles
Not everyone learns statistics the same way. Here’s how to adapt these study hacks to your preferred learning style:
Don’t force yourself into a method that doesn’t fit your brain. Use this matrix to identify the specific tools that match your learning style.
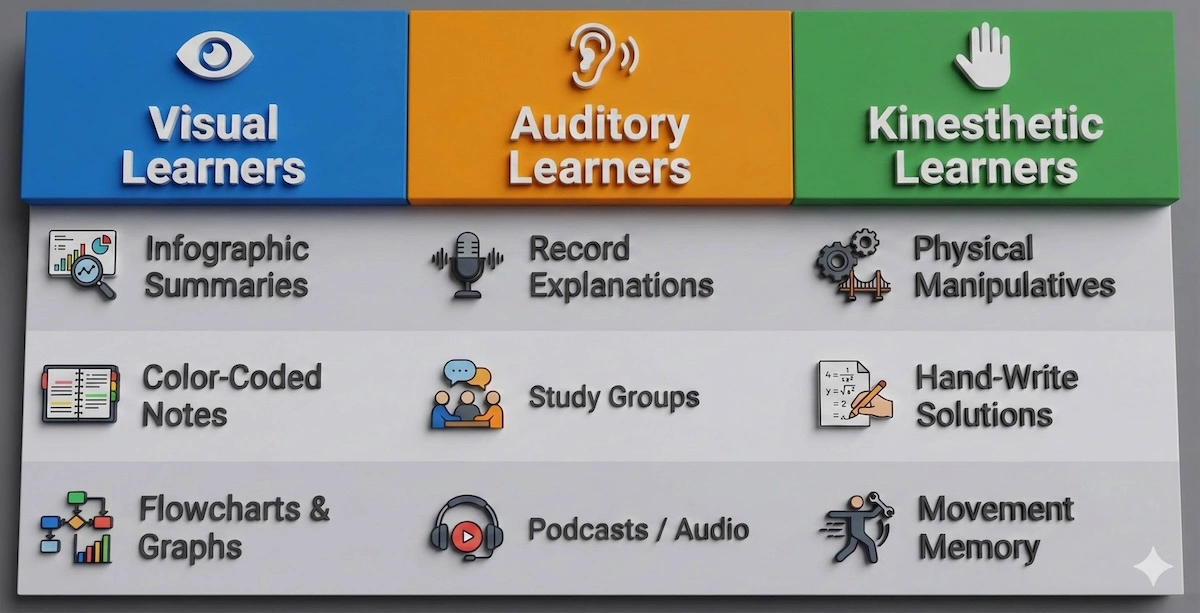
Pick one strategy from your column today and apply it to your next problem set to see the difference.
For Visual Learners
- Create infographic-style summaries of your homework solutions
- Use different colors for different statistical concepts in your notes
- Build flowcharts showing decision-making processes in statistical tests
- Convert numerical results into graphs and charts whenever possible
For Auditory Learners
- Record yourself explaining solutions and listen back during commutes
- Form study groups focused on verbal explanation of concepts
- Use the teaching portfolio strategy with emphasis on spoken explanations
- Find or create statistical concept podcasts or videos
For Kinesthetic Learners
- Use physical manipulatives to understand probability concepts
- Write out solutions by hand, even when digital copies are available
- Create movement-based memory techniques for statistical formulas
- Build 3D models of statistical distributions using clay or other materials
For Reading/Writing Learners
- Maintain detailed written reflections on each homework solution
- Create comprehensive glossaries of statistical terms in your own words
- Write blog posts or journal entries explaining statistical concepts
- Develop detailed written study guides combining multiple homework solutions
The same learning-style awareness that helps in statistics also applies when tackling proof-heavy courses — see how AP Calculus tutors support engineering success using similar adaptive techniques.
Using Technology Tools to Improve Statistics Learning
Modern students have access to powerful tools that can amplify the effectiveness of these study hacks:
Statistical Software Integration
Learn to replicate your homework solutions in:
- R or RStudio for comprehensive statistical analysis
- Excel for accessible data manipulation and basic statistics
- SPSS for user-friendly statistical testing
- Python (pandas/scipy) for programming-based statistical analysis
Mobile Learning Apps
Use smartphone apps to:
- Create digital flashcards for statistical concepts
- Record and review solution explanations
- Access statistical calculators for parameter playground exercises
- Set reminders for regular homework review sessions
Online Collaboration Tools
Leverage platforms like:
- Google Workspace for collaborative concept mapping
- Discord or Slack for real-time study group discussions
- Notion or Obsidian for comprehensive knowledge management
- GitHub for tracking your statistical learning journey
Measuring Your Progress and Success
How do you know if these study hacks are working? Here are concrete metrics to track:
Short-term Indicators (1-2 weeks)
- Can explain homework solutions without referring to notes
- Successfully complete similar problems independently
- Feel confident identifying which statistical test to use for new scenarios
- Spend less time feeling confused when starting new assignments
Medium-term Indicators (1 month)
- Improved performance on quizzes and smaller assessments
- Reduced anxiety when encountering new statistical problems
- Ability to help classmates with statistical concepts
- Faster completion of statistics assignments
Long-term Indicators (End of semester)
- Strong performance on comprehensive exams
- Retention of statistical concepts from earlier in the course
- Confidence in applying statistics to real-world scenarios
- Genuine interest in statistical analysis and research
Comparing Statistics Homework Help and Support Options
| Service Type | Best For | Pros | Cons |
| Professional Homework Help | Complex problems, conceptual explanations | Human expertise, customized solutions, detailed explanations | Higher cost, potential delay in response |
| AI Study Tools | Practice, repetition, instant feedback | 24/7 availability, unlimited practice, immediate feedback | May lack nuance for complex problems, requires self-direction |
| Peer Study Groups | Reinforcement, alternative explanations | Multiple perspectives, social learning, cost-free | Potential for shared misunderstandings, scheduling challenges |
| Office Hours & TA Help | Course-specific guidance, clarification | Free, aligned with course expectations | Limited availability, may be crowded |
Advanced Applications Beyond Homework
Once you’ve mastered these study hacks with your regular assignments, consider these advanced applications:
Research Project Integration
- Apply statistical concepts to personal research interests
- Collaborate with professors on statistical analysis projects
- Participate in undergraduate research with statistical components
- Develop statistical literacy for graduate school applications
Career Preparation
- Build a portfolio of statistical projects for job applications
- Develop expertise in industry-specific statistical applications
- Network with professionals who use statistics in your field of interest
- Gain practical experience through internships requiring statistical analysis
Peer Leadership Opportunities
- Become a statistics tutor using your teaching portfolio
- Lead study groups for students struggling with statistical concepts
- Create educational content about statistics for broader audiences
- Mentor younger students developing quantitative skills
Final Thoughts: From Surviving to Thriving in Statistics
Here’s what I want you to remember: statistics homework help isn’t a crutch—it’s a catalyst. When you combine professional assistance with strategic learning techniques, you’re not just completing assignments; you’re building genuine statistical literacy that will serve you throughout your academic and professional career.
The five study hacks we’ve covered—explain-back method, concept mapping, parameter playground, error detective, and teaching portfolio—transform passive homework completion into active skill building. You’re not just getting better grades; you’re developing the analytical thinking skills that employers value and graduate programs require.
Statistics doesn’t have to be the class you dread. With the right approach, it can become the class where you discover your capacity for rigorous analytical thinking. These study hacks, paired with quality homework assistance, provide the framework for that transformation.
Remember, every expert was once a beginner. The students who excel in statistics aren’t necessarily the ones who found it easy from day one—they’re the ones who developed effective learning strategies and stuck with them consistently.
Your statistics journey is just beginning. Make it count.
FAQs About Statistics Study Hacks
What’s the best way to combine study hacks with getting help for statistics homework?
Many students say the ideal combo is to first attempt the statistics homework yourself (even if imperfectly), then use a study-hack like the Pomodoro technique (e.g. 25 min work / 5 min break) to stay focused, then when stuck, reach out for targeted help (tutor, forum, or homework help service) for those specific sticking points. This way, you actively engage first, then supplement with help where needed.
How can students retain statistical formulas and concepts better?
A common strategy is active recall + spaced repetition: make flashcards with the formula on one side and its meaning or derivation on the other, review them in spaced intervals (e.g. using Anki or Quizlet). Also, try to explain the formula in your own words or to someone else (Feynman technique) which deepens understanding.
When stuck on a stats problem, what hack can get a student unstuck without just copying an answer?
Translate the symbols and equations into “plain English” statements. One Reddit commenter suggested:
As an exercise to see if you truly understand, it helps to translate the symbols in homework problem equations into plain English.
“Sum of squared deviations from mean,” etc. Once you understand in words, you can map back to formulas more confidently.
Are there study hacks that specifically help for statistics versus general subjects?
Yes, some targeted ones include:
- Working with real datasets (e.g. in Excel, R, Python) so you see how theory applies in practice.
- Creating or solving mini-projects or applied examples (e.g. survey design or sample data) rather than only textbook problems.
- Visualizing distributions, regressions etc. using graphs—seeing things visually often cements understanding better than raw formulas.
How do students keep motivation and avoid burnout while doing heavy stats homework?
Many share these tips:
- Start early and little by little rather than cramming late. One user said:
“Best is to start early. Don’t study 10-12 hrs a day just because. Start off slow. Maybe just half an hour, but do it consistently…”
- Take regular breaks, keep healthy habits (sleep, hydration).
- Study in a group or with a study partner so you can motivate each other.
- Reward yourself after completing difficult tasks (small treats, short fun break).
Related Reading
******************************
This article provides general educational guidance only. It is NOT official exam policy, professional academic advice, or guaranteed results. Always verify information with your school, official exam boards (College Board, Cambridge, IB), or qualified professionals before making decisions. Read Full Policies & Disclaimer , Contact Us To Report An Error