Matplotlib Tutoring Online
Create plots that reveal real patterns, communicate uncertainty clearly and avoid misleading visual conclusions in your research.
Hire a tutor for Python plotting and axes · Scientific chart customization · Interpretation and visualization qualityand more...
Request tutor availability and a quote. Or email [email protected].

Since 2008
Established Tutoring Service
~1 min
Average First Response
Specialist Match
For Your Subject & Level
30-Min Trial
Try Tutoring Before a Longer Plan
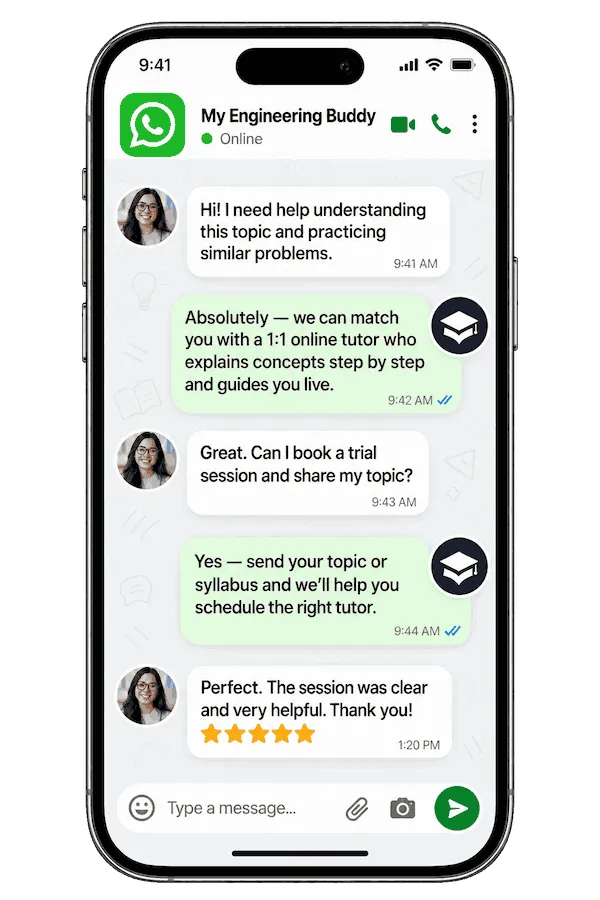
Online Matplotlib tutoring with My Engineering Buddy
A graph can contain accurate data yet be misleading because of axis scales, overlapping labels or the wrong chart type. My Engineering Buddy (MEB) provides paid, live, one-to-one online Matplotlib tutoring for students and researchers using Python to visualize data. A tutor can explain plotting objects, figure layouts and graphic choices with original examples. Sessions emphasize accurate interpretation and independent coding skills instead of producing assessed charts or analyses for you.
Topics a Matplotlib tutor can help you learn
Plotting fundamentals
- Figures, axes and object-oriented plotting
- Line, scatter, bar and histogram charts
- Labels, legends, titles and measurement units
- Axis limits, ticks and formatting
- Markers, line styles and visual contrast
Scientific and analytical graphics
- Multiple axes and subplot arrangements
- Error bars and uncertainty displays
- Distribution and density visualization concepts
- Heatmaps, images and color scales
- Datetime axes and categorical labels
Quality and troubleshooting
- Meaningful baselines and scales
- Handling missing values and outliers
- Readable annotations and legends
- Export resolution and vector graphics
- Reproducible figure code and consistent styling
Choose the topics that match your learning goal and share your current level and tools when enquiring. Relevant tutor experience varies by specialization.
How one-to-one Matplotlib tutoring works
Bring a short practice dataset or an unclear figure. The tutor can ask what comparison the reader needs to make, help you choose a suitable plot and guide you through Matplotlib’s figure and axes objects. You then adjust scales, labels and uncertainty displays, explaining how each change alters what the viewer perceives. This is more useful than copying plotting code without understanding its meaning.
Learn to recognize a common technical mistake
Truncating a bar chart’s vertical axis can exaggerate small changes, and removing outliers without explanation may conceal important structure. Equally, error bars have different meanings depending on whether they show standard deviation, standard error or confidence intervals. A tutor can help you distinguish statistical meaning from cosmetic choices so an attractive figure is also honest and interpretable.
Related subject tutoring paths
Matplotlib is a tool within Data Science tutoring. Pandas tutoring develops the transformations needed before graphing, and Anaconda tutoring helps when Python environments or packages cause issues. Seaborn tutoring covers a higher-level statistical plotting interface built on Matplotlib. Data Visualisation tutoring addresses chart selection and communication beyond one library. Linear Algebra tutoring can help with matrix and vector reasoning behind scientific plots.
Getting started with paid tutoring
Tell MEB what you need to understand, what you have already tried and which learning outcomes matter most. The page template displays current pricing and introductory options. Your tutor can guide practice and provide feedback, but you remain responsible for assessed work and professional decisions.
Questions about Matplotlib tutoring
Do I need advanced Python?
No. Basic arrays, loops and functions are sufficient to begin plotting lines and data points.
Can I practise multi-panel scientific figures?
Yes. Sessions can cover subplot layouts, error bars, units and export settings.
How is Seaborn different?
Seaborn provides a statistical plotting layer; Matplotlib offers detailed figure and axes control.
Will the tutor generate assessed figures for me?
No. MEB provides explanation and feedback while you create your own results.