5 Formulas That Separate A/AS Level Business A* Students From the Rest

- Break-even output, ROCE, gross profit margin, current ratio, and PED are the five formulas that decide A* outcomes.
- Always use operating profit for ROCE — never gross or net profit.
- Gross profit margin can fall even when absolute revenue rises.
- Interpret every calculation in business context to earn evaluation marks.
- Show all working steps to secure method marks even if the final answer is wrong.
You can memorize every A/AS Level business definition and theory, but formulas decide exam outcomes. Top students don’t just know the formulas. They apply them accurately under time pressure, interpret results in context, and avoid calculation errors that cost marks.
After reviewing Cambridge 9609, AQA, and Edexcel mark schemes, five formulas consistently separate A* students from everyone else. These aren’t just mathematical operations. They’re decision-making tools that examiners reward heavily when used correctly.
Students preparing for rigorous qualifications like IGCSE Chemistry often find that the same disciplined, formula-first approach that works in science translates directly to business exam technique.
What Students Get Wrong About Business Formulas
Most calculation mistakes happen because students treat formulas as abstract math problems instead of business analysis tools. Three patterns appear repeatedly in examiner reports.
It is crucial to recognize these patterns early. The table below highlights the difference between a standard student’s approach and an A* student’s mindset.
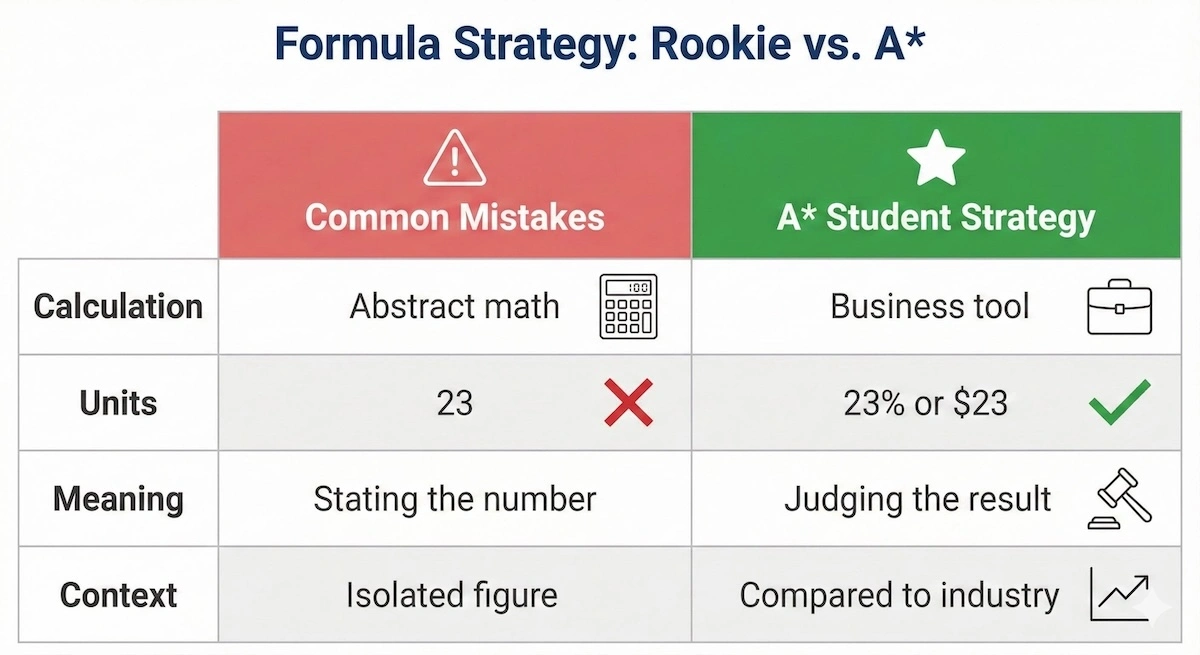
Notice how the A* approach always focuses on context and interpretation rather than just the raw number.
Students calculate correctly but fail to interpret. You might get the ROCE percentage right, but if you don’t explain whether 18% is good for a manufacturing company compared to industry benchmarks, you lose application and evaluation marks.
Students use wrong figures from financial statements. Mixing up “revenue” with “profit” or “cost of sales” with “total costs” produces meaningless answers. This happens when students rush through data extraction without checking what each line represents.
Students forget units and context. Writing “23” instead of “23%” or calculating payback as “2” instead of “2 years and 4 months” signals careless work to examiners, even when the method is correct.
Formula 1: Break-Even Output
The structure of this formula is specific. Let’s break down exactly what goes into the numerator and denominator.
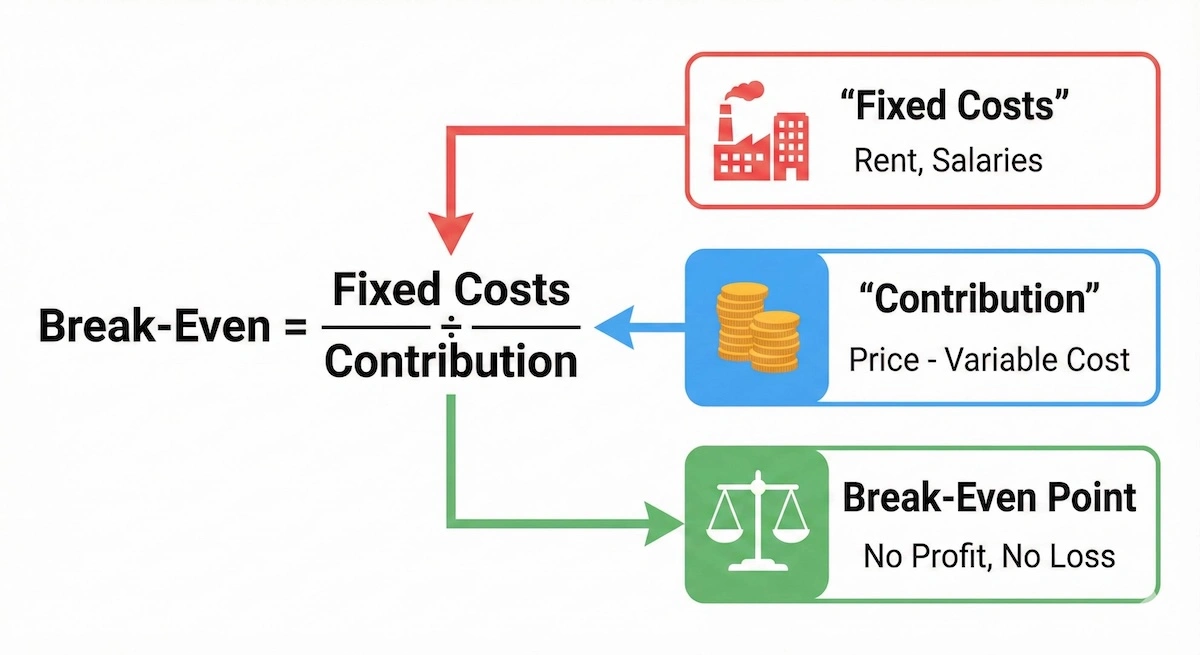
Always remember: Fixed Costs go on top, and the Contribution (Price minus Variable Cost) goes on the bottom.
Break-Even Output = Fixed Costs ÷ Contribution per unit
Where: Contribution per unit = Selling price per unit – Variable cost per unit
Break-even analysis appears in every Business exam paper. It measures the minimum output needed before a business starts making profit.
Why A* Students Master Break-Even Output
Break-even connects pricing decisions, cost structure, and profit planning. Examiners test whether you understand that businesses can reach break-even faster by either reducing fixed costs, increasing prices, or lowering variable costs per unit.
Worked Example: Calculating Break-Even
Scenario: A coffee shop sells drinks for $4 each. Variable costs (ingredients, cups) are $1.50 per drink. Monthly fixed costs (rent, salaries) total $7,500.
Step 1: Calculate contribution per unit
- Contribution = $4.00 – $1.50 = $2.50 per drink
Step 2: Apply break-even formula
- Break-even output = $7,500 ÷ $2.50 = 3,000 drinks per month
Step 3: Interpret the result. The coffee shop must sell 3,000 drinks monthly to cover all costs. At 30 days per month, this equals 100 drinks per day. Any sales beyond 3,000 drinks generate profit of $2.50 per drink.
Common Mistakes with Break-Even Output
Mistake 1: Confusing contribution with profit. Contribution covers fixed costs first. Only after reaching break-even does contribution become profit.
Mistake 2: Using total costs instead of fixed costs only. The formula requires fixed costs in the numerator, never total costs.
Mistake 3: Forgetting to calculate contribution per unit separately. Students sometimes try to subtract variable costs from revenue directly, which produces wrong results.
Advanced Application of Break-Even Output
A* students extend break-even analysis by calculating margin of safety:
- Margin of Safety = Current Output – Break-Even Output
If the coffee shop currently sells 4,500 drinks monthly, margin of safety equals 1,500 drinks. This buffer shows how much sales can drop before losses begin.
Students who also study structured programmes like IB MYP will recognise this kind of multi-step analytical thinking as a transferable exam skill across subjects.
Formula 2: Return on Capital Employed (ROCE)
Choosing the right profit figure is half the battle. This funnel shows you exactly how to derive the Operating Profit needed for ROCE.
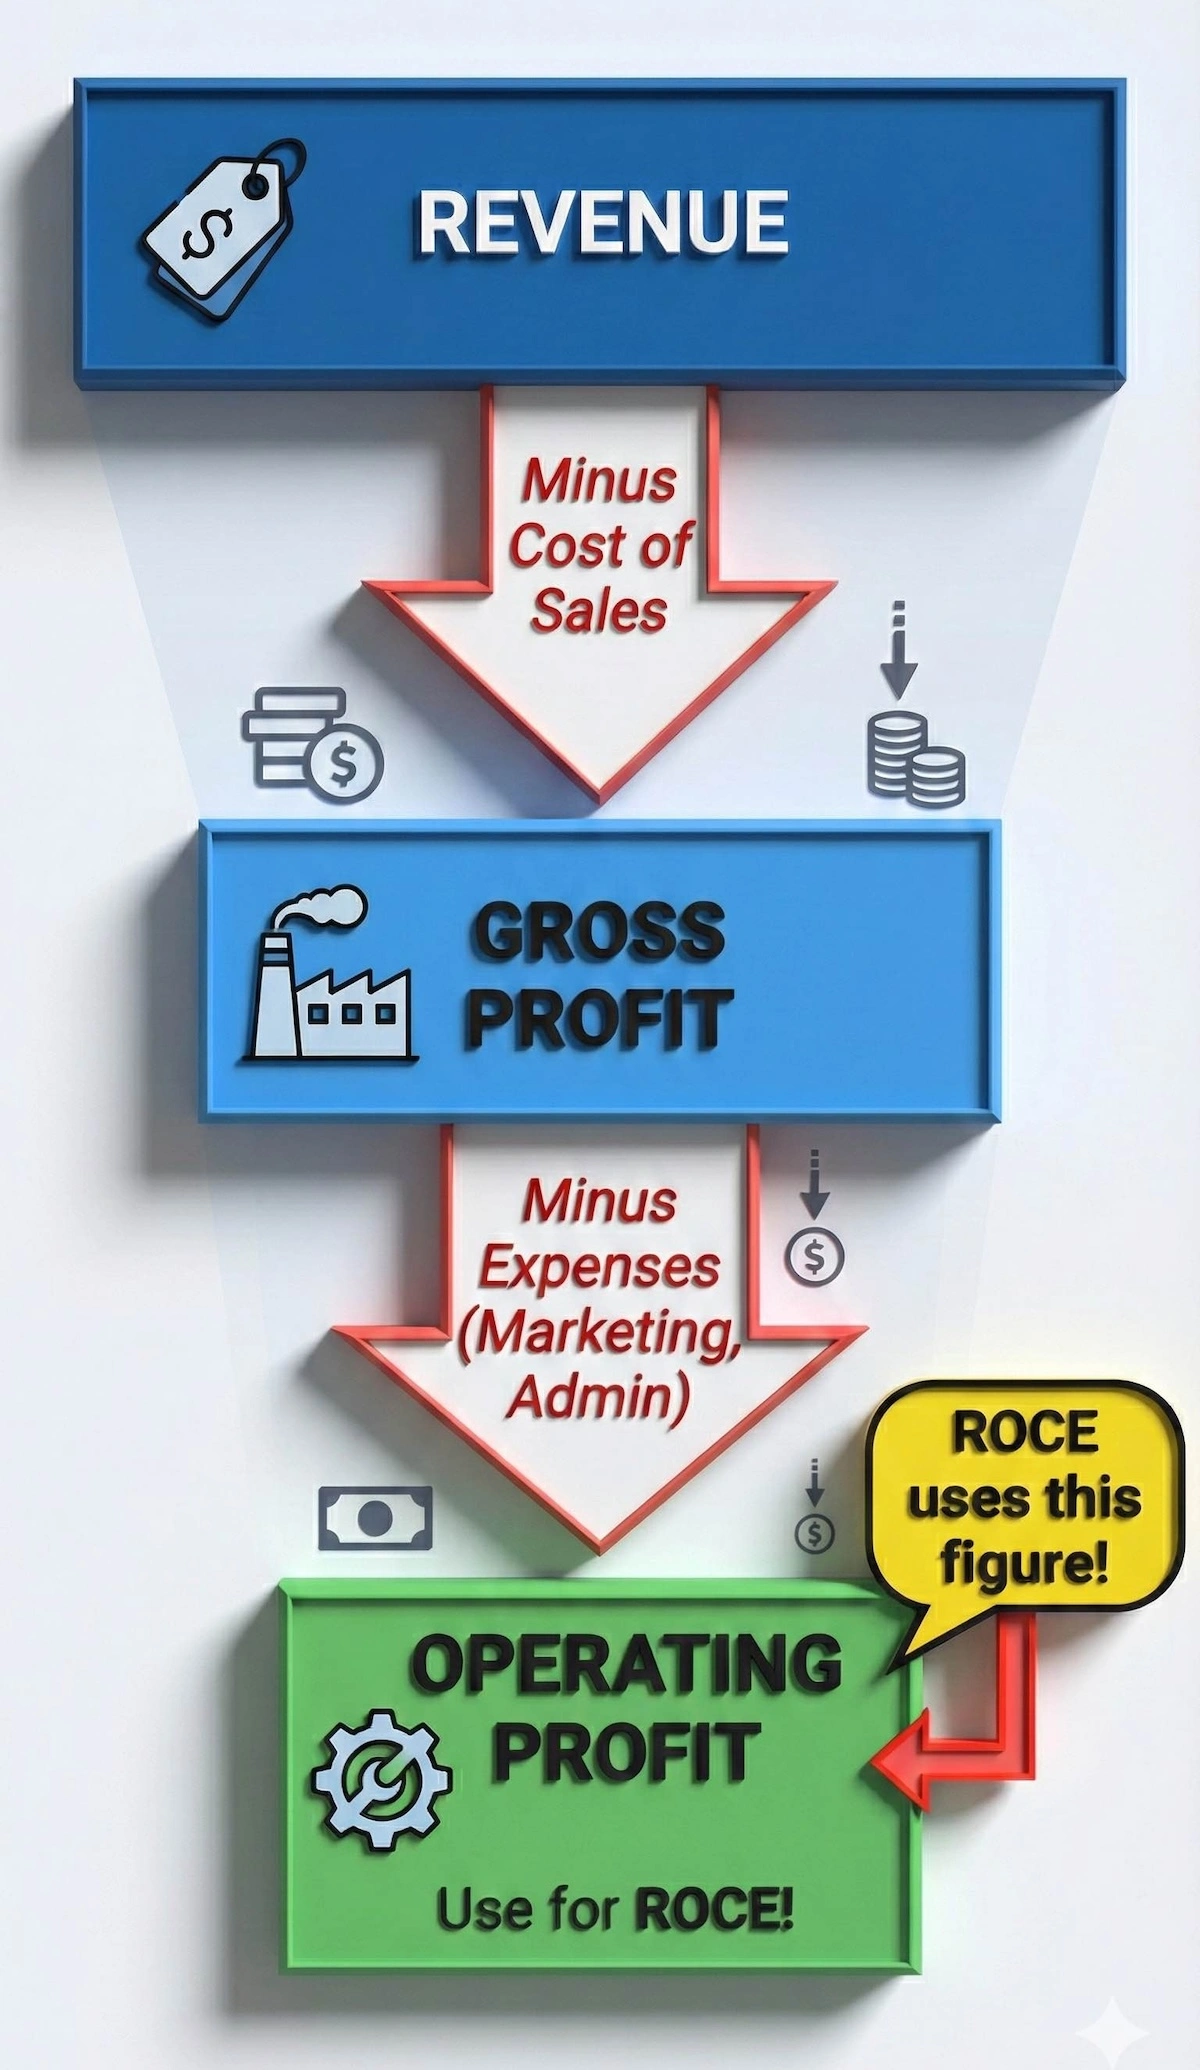
As shown above, never use Gross Profit or Net Profit for ROCE — only Operating Profit measures the core business efficiency.
ROCE = (Operating Profit ÷ Capital Employed) × 100
Where: Capital Employed = Total Equity + Non-current Liabilities
ROCE measures how efficiently a business generates profit from invested capital. It’s the most important profitability ratio in A/AS Level Business exams.
Why A* Students Master ROCE
ROCE requires understanding financial statements deeply. You must locate operating profit (not gross profit or net profit) and calculate capital employed correctly. Most students lose marks by using the wrong profit figure.
Worked Example: Calculating ROCE
Scenario: Extract from TechCorp’s financial statements:
| Item | Value ($000) |
| Revenue | 850 |
| Cost of Sales | 400 |
| Operating Expenses | 250 |
| Total Assets | 600 |
| Current Liabilities | 100 |
| Non-current Liabilities | 150 |
Step 1: Calculate operating profit
- Gross Profit = Revenue – Cost of Sales = $850k – $400k = $450k
- Operating Profit = Gross Profit – Operating Expenses = $450k – $250k = $200k
Step 2: Calculate capital employed
- Method 1: Total Assets – Current Liabilities = $600k – $100k = $500k
- Method 2: Total Equity + Non-current Liabilities = $350k + $150k = $500k
(Both methods produce the same result)
Step 3: Apply ROCE formula
- ROCE = ($200k ÷ $500k) × 100 = 40%
Step 4: Interpret the result. For every $1 of capital invested, TechCorp generates $0.40 in operating profit. A ROCE of 40% is strong, indicating efficient capital use.
Common Mistakes with ROCE
Mistake 1: Using net profit instead of operating profit. ROCE measures operational efficiency before financing decisions, so operating profit is required.
Mistake 2: Forgetting to convert to percentage. Writing “0.4” instead of “40%” loses marks.
Mistake 3: Failing to compare ROCE against benchmarks. A* students always state whether the ROCE is good by referencing industry averages or company history.
Advanced Application of ROCE
ROCE should be analyzed alongside operating profit margin and asset turnover. If ROCE increases, determine whether it’s from better margins or more efficient asset use. This demonstrates higher-order evaluation skills.
Industry benchmarks matter. A manufacturing company with 15% ROCE might underperform (industry average 20%), while a retail business with 15% ROCE might excel (industry average 8%).
The same benchmark-comparison habit applies in data-heavy subjects — students working through IGCSE Hindi as a Second Language learn to evaluate texts against established criteria rather than in isolation, a parallel analytical discipline.
Formula 3: Gross Profit Margin
Gross Profit Margin = (Gross Profit ÷ Revenue) × 100
Where: Gross Profit = Revenue – Cost of Sales
Gross profit margin shows what percentage of revenue remains after covering direct costs of production. It reveals pricing power and production efficiency.
Why A* Students Master Gross Profit Margin
This formula tests whether you understand cost classification. Cost of sales includes only direct costs (materials, direct labor). Operating expenses like marketing and administration are excluded.
Worked Example: Calculating and Analyzing Gross Profit Margin
Scenario: A furniture manufacturer has the following two-year data:
| Year | Revenue ($000) | Cost of Sales ($000) |
| 2023 | 500 | 300 |
| 2024 | 600 | 390 |
Year 2023 Calculation:
- Gross Profit = $500k – $300k = $200k
- Gross Profit Margin = ($200k ÷ $500k) × 100 = 40%
Year 2024 Calculation:
- Gross Profit = $600k – $390k = $210k
- Gross Profit Margin = ($210k ÷ $600k) × 100 = 35%
Analysis: The margin fell from 40% to 35% despite higher revenue and gross profit. This signals problems:
- Material costs may have increased faster than selling prices
- Production efficiency may have declined
- The business may have reduced prices to increase sales volume
A* students recognize this as a warning sign requiring investigation, even though absolute gross profit rose.
For students who want to sharpen their analytical writing around data like this, the guide on 5 high-impact tips to ace the 9093 commentary task offers transferable techniques for structuring evidence-based arguments.
Common Mistakes with Gross Profit Margin
Mistake 1: Including operating expenses in cost of sales. Only direct production costs belong in cost of sales.
Mistake 2: Analyzing the formula in isolation. Changes in gross profit margin must be explained using context from the scenario (price changes, supplier costs, production methods).
Mistake 3: Assuming higher revenue automatically means better margins. Revenue and margin measure different things. Revenue can increase while margins decrease if costs rise faster than prices.
Advanced Application of Gross Profit Margin
Compare gross profit margin changes with net profit margin changes. If gross profit margin stays stable but net profit margin falls, the problem lies in operating expenses, not production costs. This pinpoints where management should focus cost control efforts.
Formula 4: Current Ratio
Current Ratio = Current Assets ÷ Current Liabilities
Current ratio measures short-term liquidity, showing whether a business can pay debts due within one year.
Why A* Students Master the Current Ratio
Liquidity ratios assess financial health, not profitability. A profitable business can fail if it cannot pay suppliers on time. A* students distinguish between profitability and liquidity clearly.
Worked Example: Calculating and Interpreting Current Ratio
Scenario: RetailCo’s balance sheet shows:
| Item | Value ($000) |
| Current Assets: | |
| Cash | 50 |
| Inventory | 120 |
| Receivables | 80 |
| Total Current Assets | 250 |
| Current Liabilities: | |
| Payables | 100 |
| Bank Overdraft | 50 |
| Total Current Liabilities | 150 |
Calculation:
- Current Ratio = $250k ÷ $150k = 1.67:1
Interpretation: RetailCo has $1.67 of current assets for every $1 of current liabilities. The business should comfortably meet short-term obligations.
The benchmark for current ratio is 1.5-2:1. Anything below 1:1 signals potential liquidity problems. Ratios above 3:1 might indicate inefficient use of resources (too much cash sitting idle).
Common Mistakes with the Current Ratio
Mistake 1: Confusing current ratio with quick ratio. Current ratio includes inventory, quick ratio excludes it.
Mistake 2: Stating “higher is always better.” Excessively high current ratios suggest poor working capital management.
Mistake 3: Ignoring industry context. Supermarkets operate successfully with current ratios around 0.5:1 because they receive cash immediately but pay suppliers later. Manufacturing firms need higher ratios due to longer cash conversion cycles.
Advanced Application of the Current Ratio
Analyze the composition of current assets. A current ratio of 2:1 looks healthy, but if 80% is slow-moving inventory and only 10% is cash, liquidity risk remains high. A* students dig deeper than surface-level ratios.
Students who enjoy the logical rigour of ratio analysis often find similar satisfaction in AP Biology, where interpreting experimental data against expected benchmarks is an equally critical skill.
Formula 5: Price Elasticity of Demand (PED)
PED = % Change in Quantity Demanded ÷ % Change in Price
PED measures how responsive demand is to price changes. This guides pricing strategy decisions.
Why A* Students Master PED
PED connects to revenue changes, which many students miss. If demand is elastic (PED > 1), price cuts increase total revenue. If demand is inelastic (PED < 1), price increases raise total revenue.
Deciding on a pricing strategy based on elasticity can be simplified. Use this decision tree to determine the revenue-maximizing move.
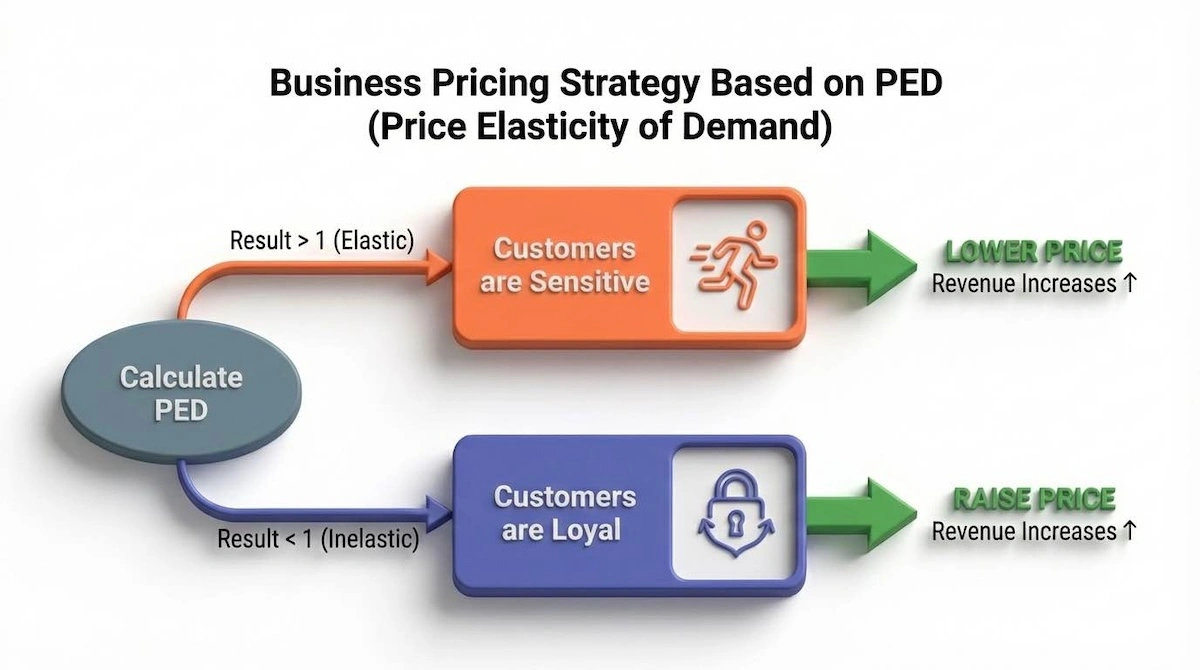
Memorize this flow: Elastic means lower the price; Inelastic means raise the price.
Worked Example: Calculating and Using PED
Scenario: A smartphone manufacturer reduces price from $800 to $720 (10% decrease). Weekly sales increase from 1,000 units to 1,400 units (40% increase).
Step 1: Calculate percentage changes
- % Change in Price = [($720 – $800) ÷ $800] × 100 = -10%
- % Change in Quantity = [(1,400 – 1,000) ÷ 1,000] × 100 = 40%
Step 2: Apply PED formula
- PED = 40% ÷ (-10%) = -4
(Ignore the negative sign in interpretation)
Step 3: Interpret the result. PED of 4 means demand is highly elastic. A 1% price decrease leads to a 4% increase in quantity demanded.
Step 4: Calculate revenue impact
| Measure | Before | After |
| Price | $800 | $720 |
| Quantity | 1,000 units | 1,400 units |
| Revenue | $800,000 | $1,008,000 |
The price cut increased revenue by $208,000 because demand was elastic.
Common Mistakes with PED
| Mistake Type | Common Example in Exams | A* Correction Strategy |
| Formula Misuse | Using Current Ratio instead of Acid Test Ratio when evaluating liquid assets. | Clearly state why Inventory is removed from Current Assets in the Acid Test calculation (it is the least liquid asset). |
| Unit Error | Stating ROCE as a value ($1.50) instead of a percentage (%). | All profitability and efficiency ratios must be presented as percentages. Liquidity ratios are expressed as X:1 (Source 1.2). |
| Rounding Error | Rounding intermediate calculation steps, leading to an inaccurate final answer. | Carry the unrounded figure in your calculator memory and only round the final answer to two decimal places or the nearest dollar/percentage as context demands. |
| Interpretation Gap | Saying a high Gearing Ratio is “bad” without further qualification. | A high Gearing Ratio is only bad if the business cannot afford the interest payments (Interest Cover Ratio). Evaluate the risk, not just the number. |
Practical Application: The Quant-Qual Integration Loop
Use the following three-step loop to turn any calculation result into an A* evaluation:
- Calculate & Identify: Calculate the formula and clearly state the result (e.g., “The Acid Test Ratio is 0.8:1”).
- Analyze & Contextualize (AO3): Explain the meaning in the case study’s specific context (e.g., “This ratio is below the 1:1 benchmark, indicating a short-term liquidity problem. This is a significant risk for the construction company given the current economic recession mentioned in the case.”).
- Evaluate & Recommend (AO4): Provide a balanced, justified recommendation (e.g., “The low ratio suggests the firm needs to tighten credit control, unless they have negotiated a large overdraft facility, which would mitigate the short-term risk.”).
Advanced Application of PED
PED varies by market segment and product life cycle stage. Luxury products often have elastic demand (consumers switch to alternatives when prices rise). Necessities like gasoline have inelastic demand (consumers buy regardless of price changes).
A* students recommend pricing strategies that account for elasticity. For elastic demand products, compete on price and volume. For inelastic demand products, maximize revenue through premium pricing.
The structured, algorithmic thinking behind PED analysis is also central to AP Computer Science A, where students learn to trace logical decision paths through code — a comparable discipline of following rules to reach precise outcomes.
How to Apply These Formulas in Exams
Calculations alone won’t get you top marks. You need to apply the ‘Quant-Qual Integration Loop’ shown below.

By cycling through Calculation, Context, and Recommendation, you ensure every answer hits the AO3 and AO4 assessment objectives.
Examiners reward structured calculation work. Follow this approach for every numerical question:
- State the formula clearly. Write out the formula before substituting numbers. This earns method marks even if your calculation contains errors.
- Show all working. Never jump to final answers. Demonstrate each calculation step. This allows examiners to award partial credit.
- Label your answer with correct units. Include “%” for ratios, “$000” for financial figures, or “units” for quantities.
- Interpret in business context. Explain what your answer means for the business. Connect calculations to decision-making or performance evaluation.
- Make recommendations when appropriate. Don’t just calculate ROCE and stop. Explain whether the result indicates strong performance or problems requiring action.
Students who want to see how this structured approach applies to extended writing tasks can read how to write the perfect A-level English essay from context to conclusion in 6 steps — the same principle of building an argument from evidence applies across disciplines.
Common Formula Traps to Avoid
Units confusion: Financial statements often present figures in thousands ($000) or millions ($m). Check whether $450 means $450,000 or $450 million before calculating.
Wrong profit figure: Operating profit, gross profit, and net profit are different. Read questions carefully to identify which the formula requires.
Ignoring time periods: Payback might be “3.4 years” but some exams want “3 years and 5 months.” Know how to convert decimals of years into months.
Rounding too early: Only round final answers, not intermediate calculations. Early rounding compounds errors.
Missing the second step: Many Business questions require calculation followed by evaluation. Calculating break-even correctly but failing to discuss whether it’s achievable loses half the marks.
For students managing time pressure across multiple calculation questions, the strategies in A-level Geography time management: 5 steps for Paper 4 offer a practical framework that transfers well to Business exam conditions.
Understanding what makes an exam genuinely difficult is also worth exploring — the post on whether A-level English Language 9093 is hard and the easy-option myth challenges common assumptions about subject difficulty in ways that apply to Business too.
Related Reading
******************************
This article provides general educational guidance only. It is NOT official exam policy, professional academic advice, or guaranteed results. Always verify information with your school, official exam boards (College Board, Cambridge, IB), or qualified professionals before making decisions. Read Full Policies & Disclaimer , Contact Us To Report An Error